Operations Intelligence solutions that provide historical system health and performance information to make data driven operational decisions.
Products we work with
- F5
- Genesis
- HYCU
- Kalibre Insight
- Micro Focus
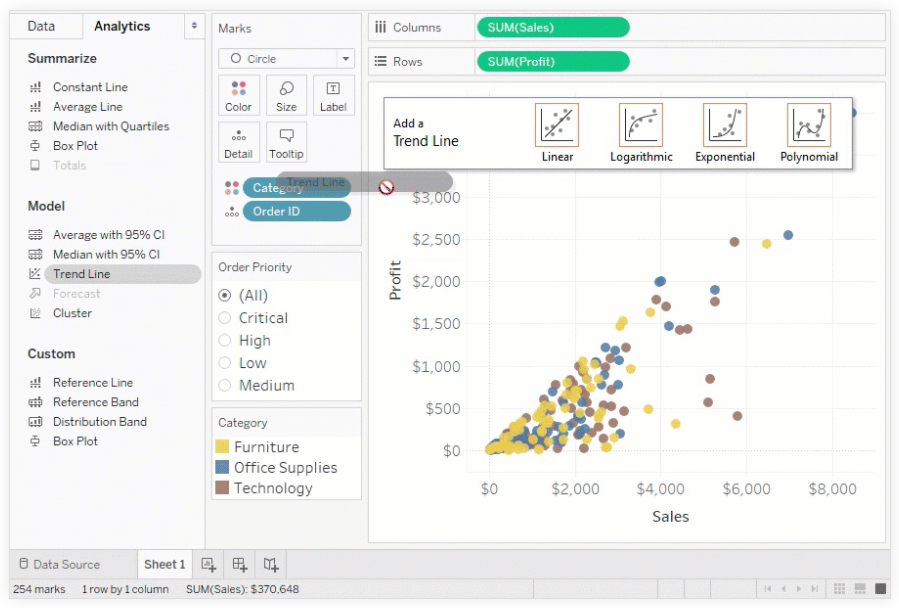
- Tableau
- Veeam
- Zerto
Get the key information you need to make better business decisions within seconds.
Kalibre Insight and Tableau transform operational data into actionable information through advanced analytics.
Gain near-real-time visibility into critical performance data to quickly identify issues and take immediate action.
- Faster reporting & analysis
- Better business decisions
- Improved data quality
- Improved employee satisfaction
- Improved operational efficiency
- Improved customer satisfaction
- Increased competitive advantage
The power to make data driven decisions
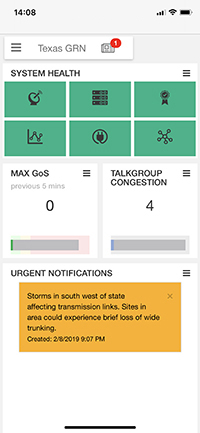
Kalibre Insight Dashboard
Web based portal
The Kalibre Dashboard is a responsive web based portal that displays near real time business information available to users in any location on any device.
User defined views
Designed to enable people ranging from system managers to end users with the business data to make both tactical and strategic operational decisions.
Near-real-time data
Near-real-time system performance data is pre-cached by the Dashboard to ensure users are presented with key information within seconds.
Modern Data Visualisations
The views utilise modern data visualisation and chart methodology to enable users to quickly identify issues without being overloaded with data.
Features
Performance visibility
Visibility of performance and status via a web-based dashboard viewable on desktops, tablets or smartphones.
Detailed aggregation
Perform detailed aggregation and analysis on the raw data to provide historical and near-real-time congestion and capacity information.
Deep Analytics
Deep analytics on the historical performance data.
Simulation
Display upcoming planned maintenance or simulate the impact of outages on coverage.
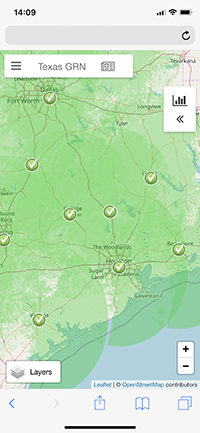
GIS Layers
Site level performance metrics displayed to users via GIS from any provider such as Google & OpenStreetMap with advanced overlays including data from the Australian Bureau of Meteorology.
Notifications
SMS and email notifications driven from KPI status.